Making a graph in Excel it pretty simple!
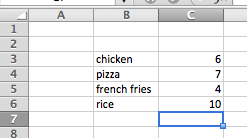
First, enter your data neatly into columns and rows,
like this:
(make sure each piece of information is in its own cell)
First, enter your data neatly into columns and rows,
like this:
(make sure each piece of information is in its own cell)
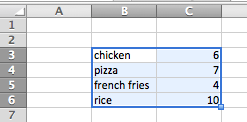
Next, you're going to click and drag over your data only- don't highlight any extra blank cells!
Start by clicking on the first cell you typed in and drag it from there, (for example click chicken, hold that click! and drag it until you highlight all of your data)
You may notice your first cell won't turn blue- that's ok.
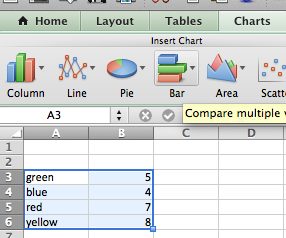
Now, go to the CHARTS tab and choose a chart that would best represent your data. (Most likely a bar graph, column chart, pie chart or other.)
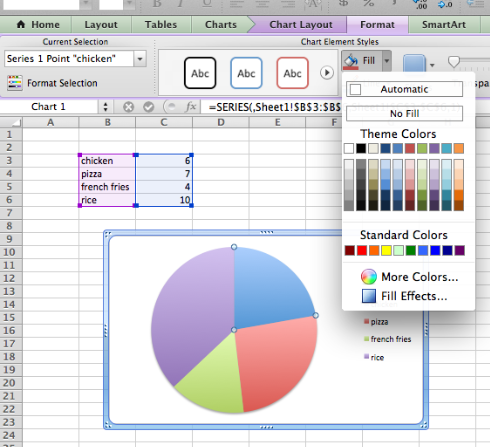
Then, edit the colors in your chart by clicking on the columns, bars, or pie pieces to select all of them.
Then, click on an individual piece to change that piece's color.
Go to the FORMAT tab to fill it with color.
|

|
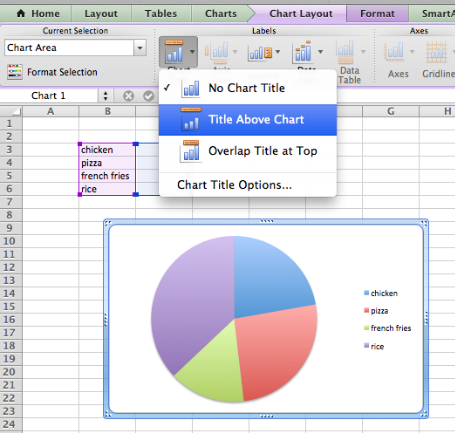
Finally, add a title to your chart by clicking on the CHART LAYOUT tab, and finding Chart Title.
*If you make a bar or column chart, add Axis Titles as well.
|

|
*Make sure you COMMAND+Q and click SAVE to update your work.
Photo from franchiseopportunitiesphotos
